Scenario: The Head of Department asks for statistics of your latest assessment.
The statistics are available on both views.
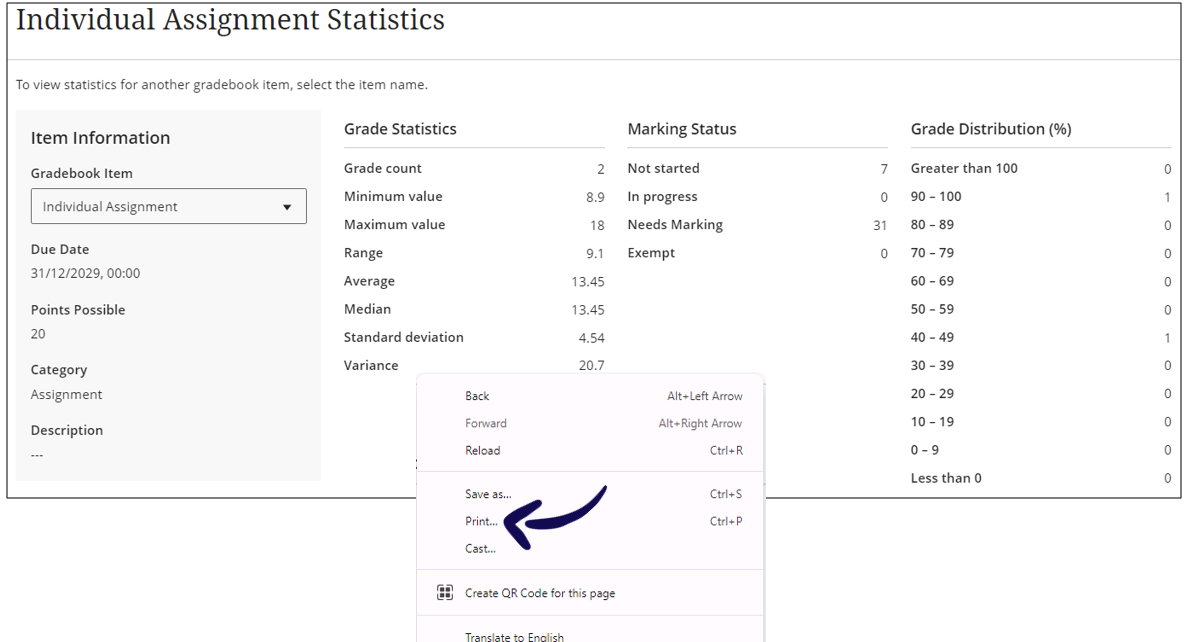
Item statistics give insight to course members' overall performance on a graded content. Now, instructors can select a column in the gradebook to access summary statistics for any graded item. The statistics page displays key metrics such as:
- Minimum and maximum value
- Range
- Average
- Median
- Standard deviation
- Variance
The number of submissions requiring grading and the distribution of grades also displays.
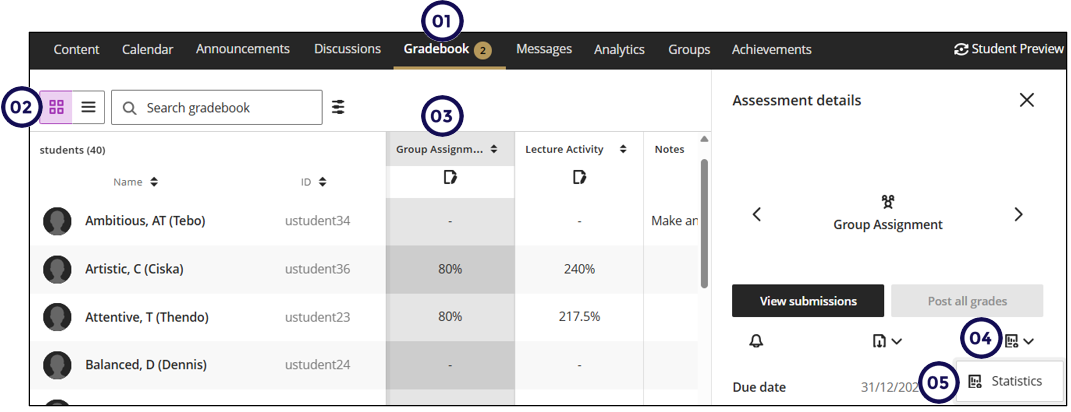
From the Grid view
Follow these steps to access the statistics:
- Click on Gradebook.
- Click on the Grid view icon.
- Click on the assessment's name to display the assessment details panel.
- Click on the statistics icon.
- Choose Statistics.
![grid_assessment_details_view]
- This provides a summary of the assessment's grade statistics. To print this, right click inside the window and choose print.
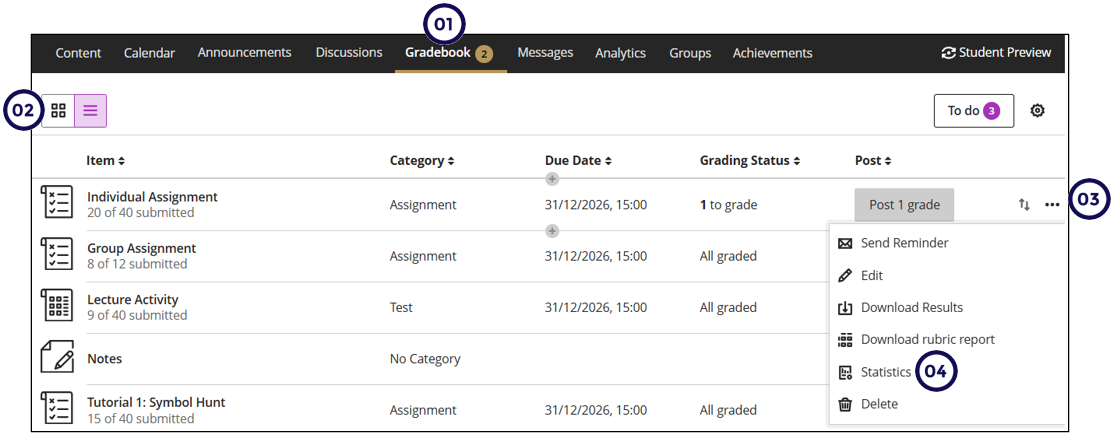
From the List view
Follow these steps to access the statistics:
- Click on Gradebook.
- Click on the List view icon.
- Click on the ellipses of the assessment which statistics you require to display the menu.
- Click on the statistics icon.
Statistics on Current Grade (or any calculation item)
You can sort the grades for calculations from low to high or high to low. To download See the steps below for a work around should you need to get the Statistics on a calculation item.
Scenario: You have a number of practicals but only the top 5 should count towards the semester mark. You created a weighted calculation to compute the Practicals contribution to the semester mark.
The Head of Department asks you to send a summary of statistics of the practicals the students completed so far.
Due to the fact that you cannot yet get statistics from the calculation items, you need to transfer the values from the Practicals calculation to a Practicals gradable item. We will use the Download and Upload to Excel process to achieve this:

- Add a gradable item called Practicals (Excel).
- Download the Practicals calculation and Practicals (Excel) gradable items only.
- Open the downloaded Excel file:
- Copy the heading of the Practicals (Excel) gradable item.
- Paste it on the the Practicals calculation heading.
- Save and close the Excel file (DO NOT CLICK ON SAVE AS).
This is an example of how to copy a heading from one Excel column to another to help you populate a new column with existing data:

- Go back to clickUP and upload the Excel file.
- Go to the Practicals (Excel) gradable item, click on the ellipsis (three dots), and select statistics.
Credit to Blackboard Help